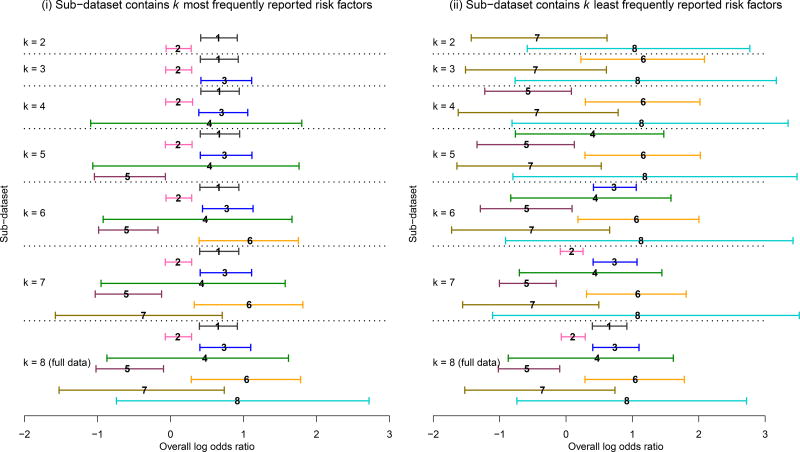
Figure 4.
Bayesian estimates of overall log odds ratios produced by Model H based on subsets of the pterygium data. Each horizontal solid line represents 95% CrI of log odds ratio. The number placed at the median log odds ratio within each 95% CrI represents the corresponding risk factor’s label. The results of the sub-datasets that contain k = 2, …, 8 risk factors are accordingly listed from upper to lower, separated by the dotted lines.

