
Figure 2. Effect of addition and wash out of soluble recombinant Tat (rTat) on restoration of neuronal activity.
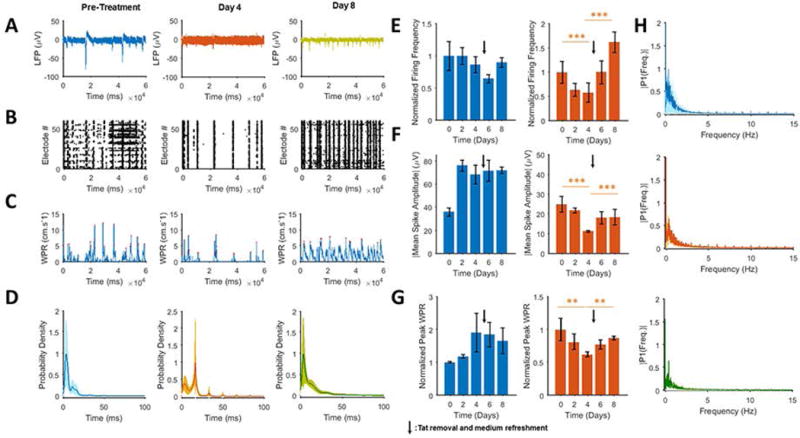
A. Extracellular action potential recordings of pre-treatment (left), after two 100 ng/day applications of rTat (middle) and four days post-rTat removal (right) shows that rTat attenuates neuronal spiking, both in its frequency and amplitude. rTat removal restores the firing frequency but only partially restores the amplitude. B. Raster plots shows that 48 hours of rTat treatment (middle) reduces the number of bursts by two fold. Highly synchronized bursts were restored throughout the network after rTat removal (right). C. Calculation of WPRs, corresponding to the LFP recordings, demonstrates restoration of the network-wide activity; pretreatment (left), after rTat (middle) and after rTat removal (right). D. Probability density peak of the inter-spike distributions shows a remarkable shift from 4 ms (pretreatment) to 20 ms (rTat treatment) and a rebound to 4 ms after rTat removal. E. Time variations of the normalized firing frequency of rTat-treated neurons compared to the control culture (heat inactivated Tat-treated). The firing rebound is apparent from day 4 onward for the rTat groups. F. Time variations of the normalized absolute peak firing amplitudes of the rTat (right) vs. control (left). Similar to the firing frequency, the spike amplitudes undergo restoration upon rTat removal. G. Normalized mean peak WPR also shows a reduction and partial restoration upon application and removal of rTat (right), while the control group follows an increasing and decreasing pattern (left) H. Frequency content spectrum of the LFP signal for pretreatment (top), rTat applied (middle) and rTat removed (bottom) groups indicate the lowered power of 0–5 Hz components in presence of rTat, however removal of rTat does not improve this parameter. Quantified data show mean ± StDev; as determined bystudent t-test, **= p<0.01, ***= p<0.001.