
Figure 7. Neuronal network analysis of inhibition of GABA receptors in the presence of Tat.
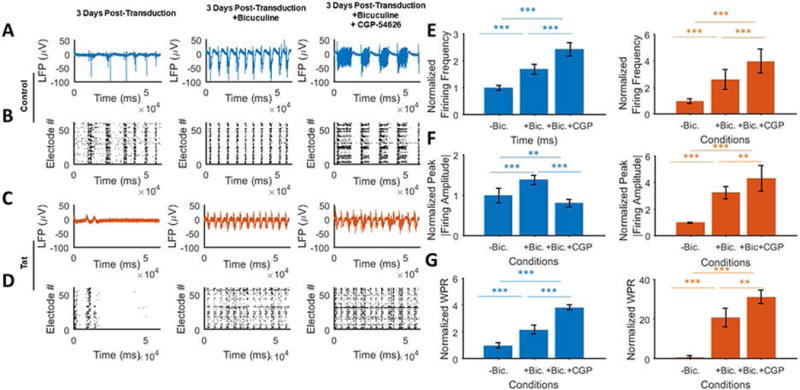
A. Extracellular action potential recordings of cultured neurons in the absence of GABA receptors inhibitors (left) and after applying bicuculline alone (GABAA receptor antagonist) (middle) or with CGP-54626 hydrochloride (GABAB receptor antagonist) (right) in Ad-Null transduced cultures. Inhibition of both GABA receptors leads to an immediate increase in the number and amplitude of the firing activity, and long bursts. B. Raster plots (bottom) of the detected spikes show highly synchronous bursting and long spiking activities induced by GABA inhibition. C. MEA recordings of pre- (left) and post-GABA-receptors inhibition in the presence of Tat expression (middle and right). Similar to the control group, GABA receptor inhibition leads to high amplitude and long bursts. While the firing amplitude is lower than the control group, the rebound activity is higher spontaneous bursting. D. Detected spikes raster plots of the Tat expressing neurons under the GABAA (middle) and GABAA and GABAB receptors inhibition (right). In the latter case, unlike the control groups, which show longer and fewer bursts, GABAB receptor antagonist results in slightly longer bursts without lowering their number. E. Normalized firing frequency of control (left) vs. Tat expressing (right) cultures. Both groups show a relatively proportional increase in the number of spikes when exposed to the antagonists. This response is more significant in the Tat group. F. Normalized peak firing amplitude of the control (left) and Tat expressing (right) groups. While bicuculline increases the absolute amplitude in both cases, the control group experiences a reduction as a result of CGP-54626. G. GABA receptor inhibition significantly increases the wave propagation rates in the neuronal network, with higher folds for the Tat groups. This implies that the lowered neuronal activity in the case of Tat is not primarily due to injury of neuronal processes, metabolic impairments or ion channel down regulation, but is due in large part to the increased inhibitory effect or decreased excitatory effects. Quantified data show mean ± StDev as determined by student t-test, **= p<0.01, ***= p<0.001.