
Figure 3. Forest plot of the results from additional analyses based on the risk-stratified groups.
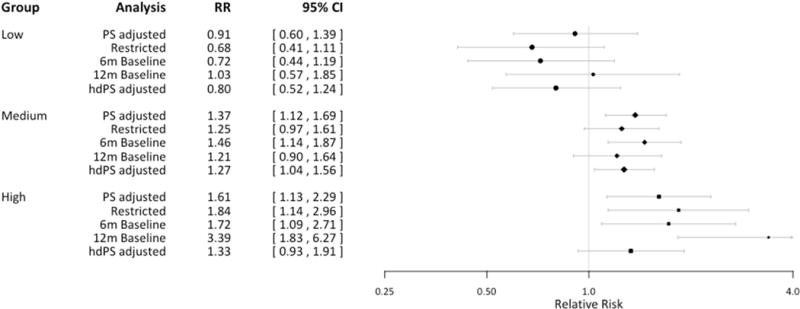
PS: Propensity score; hdPS: high-dimensional propensity score; RR: relative risk
PS adjusted: adjusted RR from PS stratification in the main analysis
Restricted: analysis restricted to women with diagnosis of schizophrenia, bipolar disorder, or depression
6m or 12m baseline: results from extending 3-month baseline to either 6 months or 12 months
hdPS adjusted: stratification adjustment using 50 additional confounder proxy variables in PS estimation