
Figure 1. Values predicted from the fixed effects of the best-fitting model for Geriatric Depression Scale (GDS) total scores, as a function of PiB and depression history.
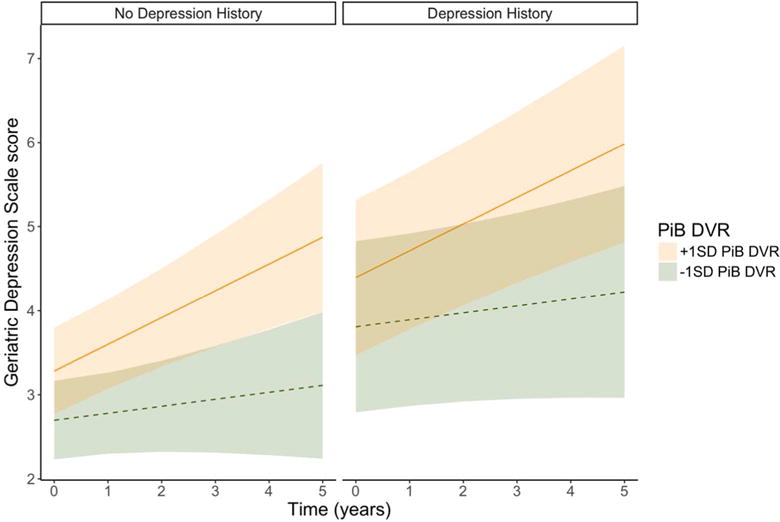
GDS trajectories corresponding to PiB values 1 standard deviation (SD) above (solid line) and 1 SD below (dotted line) the mean value of PiB (1.17) are shown with 95% confidence limits. Model predictions by history of depression are shown separately. Depression history is related to vertical elevation of lines across the whole span of the study, whereas PiB is related to the slope of the lines; higher PiB is associated with a steeper upward slope.