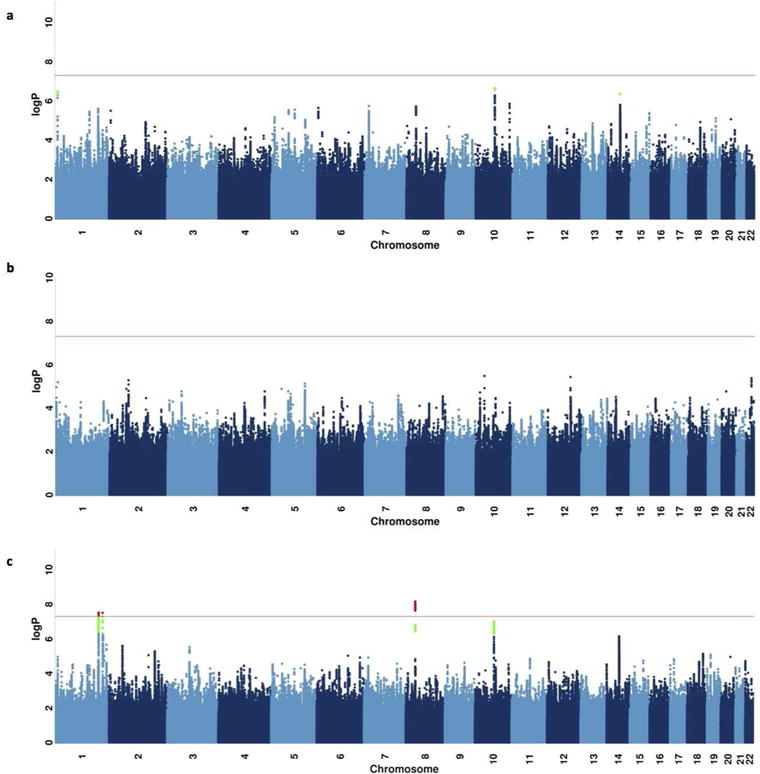
Figure 1.

Manhattan plots of loci associated with major depression.
(a) Manhattan plot of major depression for all subjects for whom information on exposure to adversity is available; (b) Manhattan plot of major depression in a subgroup reporting exposure to adversity; (c) Manhattan plot of major depression in a subgroup reporting no exposure to adversity. In each plot, the -log10 P-values of imputed SNPs associated with major depression by leave-one-chromosome-out linear mixed model association in BOLT-LMM are shown on the left y axes. The horizontal axis gives the position on each chromosome; chromosomes are numbered below the axis.
