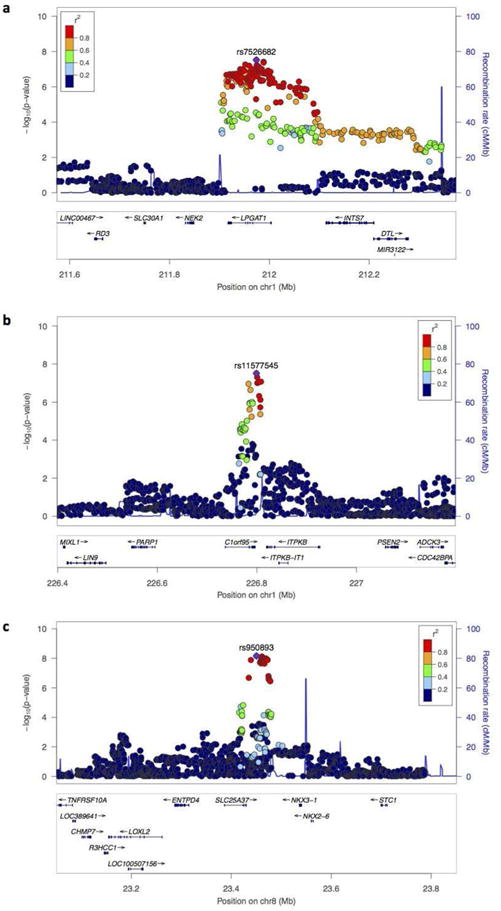
Figure 2.

Genes at three loci associated with major depression in the subgroup reporting no adversity.
(a) Locus on chromosome 1, 212 Mb, over the gene encoding lysophosphatidylglycerol acyltransferase 1 (LPGAT1) (peak SNP = rs7526682,); (b) Locus on chromosome 1, 226 Mb, over the gene C1ORF95 (peak SNP = rs11577545); (c) Locus on chromosome 8 at 23.4Mb, over the 3′ end of the mitoferrin gene SLC25A37 (peak SNP = rs950893). The -log10 P-values of imputed SNPs associated with major depression by logistic regression are shown on the left y axes together the recombination rates (NCBI Build GRCh37), represented by light-blue lines, with scales on the right y axes. Genes within the regions are shown in the bottom panels. The horizontal axis gives the chromosomal position in megabases (Mb). The index SNPs are shown as larger purple diamonds labeled by their marker names; linkage disequilibrium (hg19 1000 Genomes ASN panel Nov 2014) with the remaining SNPs is indicated by different colors.
