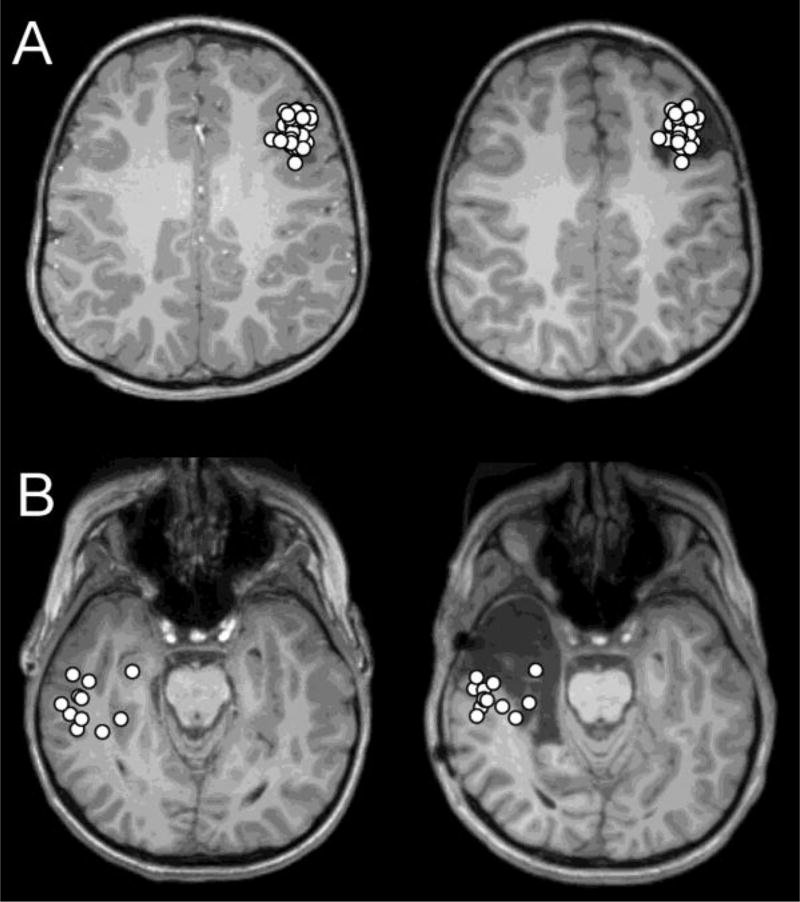
Figure 1.
(A) Dipole distribution of a patient in the seizure-free group (Patient 16), projected on the presurgical (Left) and postsurgical (Right) MRI. Most dipoles are tightly clustered (average nearest neighbor distance=2.3 mm, within 10 mm=0.65) and located within the resection. (B) Dipole distribution of a patient in the seizure-persistent group (Patient 23), projected on the presurgical (Left) and postsurgical (Right) MRI. Most dipoles are loosely clustered (average nearest neighbor distance=5.6 mm, within 10 mm=0.26) and located outside the resection.

