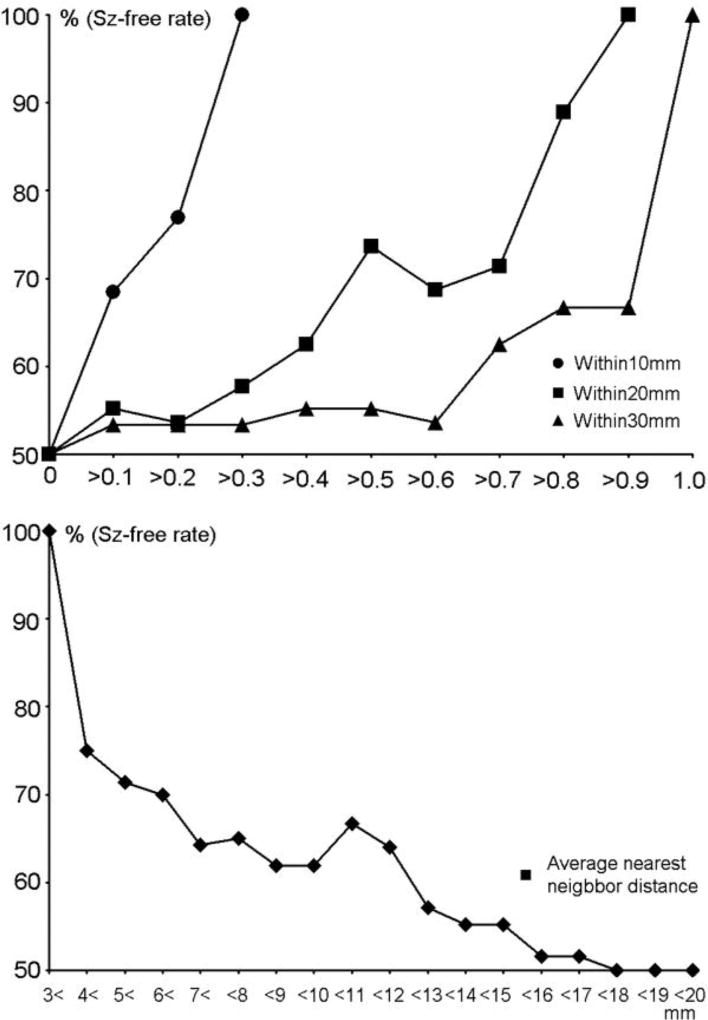
Figure 2.
(Upper) The rate of postsurgical seizure-free patients (%) is plotted corresponding to the threshold of within 10 mm (circle), within 20 mm (square), within 30 mm (triangle). The trend shows that larger values of within 10 mm, within 20 mm and within 30 mm result in a higher rate of seizure-free patients. (Lower) The rate of postsurgical seizure-free patients (%) is plotted corresponding to the threshold of average nearest neighbor distance. The trend shows that larger average nearest neighbor distances result in a lower seizure-free rate.

