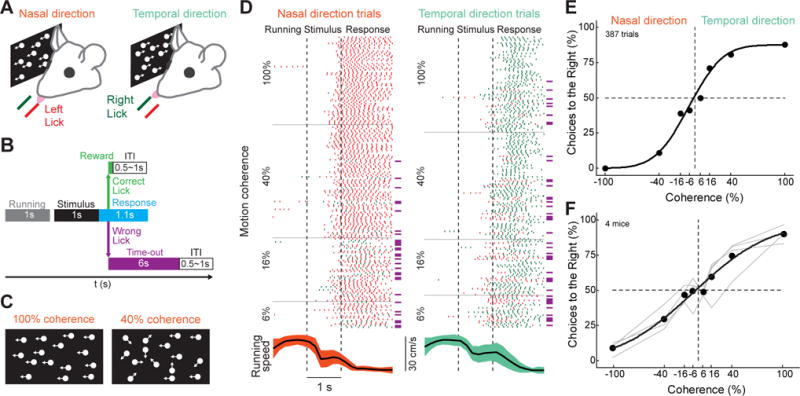
Figure 1. Mice perform a self-initiated head-fixed 2AFC motion discrimination task.

(A) Schematic of the 2AFC motion discrimination task. Mice report the direction of a random dot kinetogram by either licking the left lickport (nasal moving stimulus) or the right lickport (temporal moving stimulus). Stimulus is presented monocularly to the right eye. (B) Trial structure. To initiate a trial, mice run for 1s in a linear treadmill. The stimulus is then presented for 1s and the decision is determined by the first lick during the response period immediately after the stimulus offset. Correct choices are rewarded with a drop of water and wrong choices are punished with a time-out. (C) Schematic of random dot kinetograms in the nasal direction with 100% coherence (left) and 40% coherence (right). (D) Example session with trials sorted by side (left, nasal; right temporal) and coherence (arranged bottom to top from low to high coherences). Each row is a trial. Red ticks, left licks; green ticks, right licks. Purple lines, wrong trials. Bottom, average trial running speed traces. Black lines, mean; shaded areas, SD. Dashed lines, stimulus onset and offset. (E) Psychometric curve of session in (D). Nasal moving stimuli are represented with negative coherences. (F) Population psychometric curve (circles, mean; black line, fit; gray lines, individual animals). See also Figures S1 and S2.
