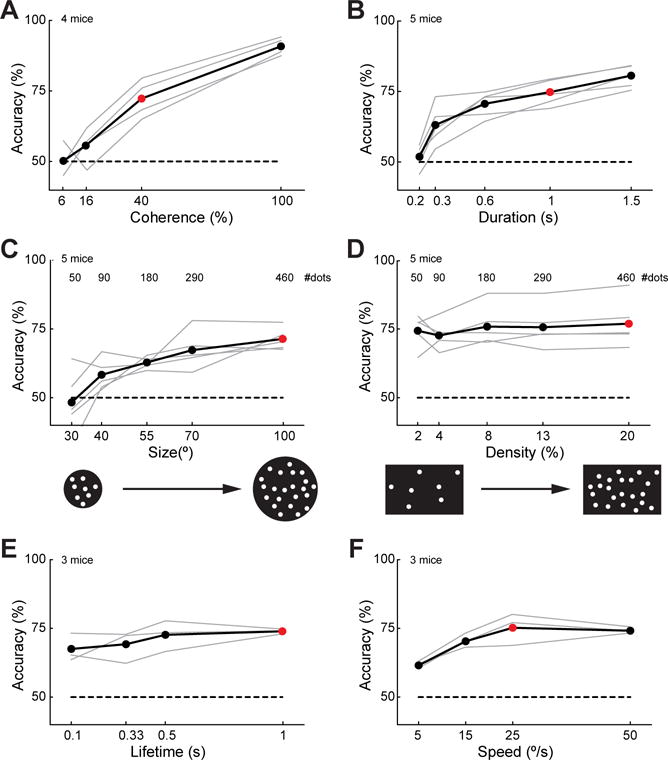
Figure 2. Mice integrate motion information in time and space.

(A) Performance in the motion discrimination task as a function of stimulus coherence (same sessions as in Figure 1F). (B–F) Same as in (A) but for stimulus duration, stimulus aperture size, dot density, dot lifetime and dot speed, respectively. Circles and black line, mean; gray lines, individual animals. Red circles represent the standard parameter values. For (B–C), number of dots present in the monitor is shown over the curve and cartoons of the stimuli are shown under the plot. See also Figures S3 and S4.
