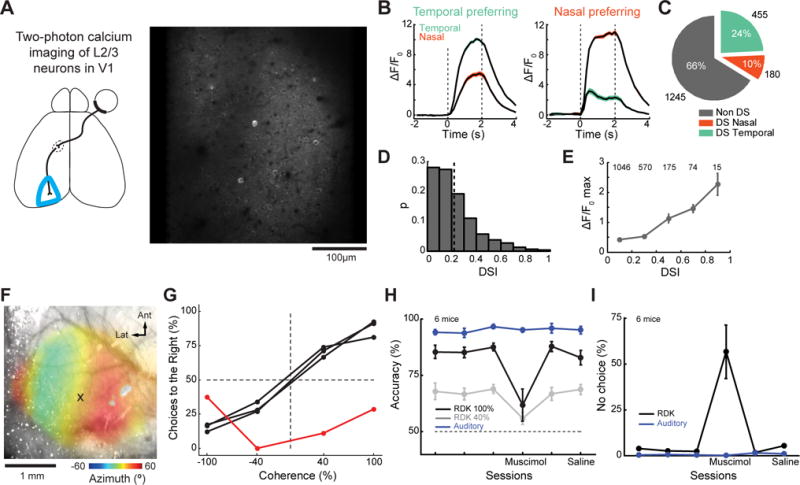
Figure 3. RDK motion direction discrimination requires activity in contralateral V1.

(A) Two-photon field of view of a single plane of L2/3 V1 in a Thy1-GCaMP6s mouse. (B) Mean fluorescent responses to RDKs for two example DS L2/3 V1 neurons (left, temporal preferring; right, nasal preferring). Black line, mean. Shaded area, SEM. Color corresponds to the motion direction (orange, nasal; green, temporal). Dashed lines, stimulus onset and offset. (C) Relative abundance of non-DS, nasal or temporal preferring DS neurons. (D) Distribution of DSI for visually responsive L2/3 V1 neurons. Dashed line, mean of the distribution (0.22). (E) Population mean ΔF/F0 max as a function of DSI. Neurons were binned in DSI intervals of 0.2. Circle, mean; errorbars, SEM. Numbers on top correspond to the number of neurons in each bin. (F) Intrinsic signal imaging through the intact skull used to identify V1. Cross marks the muscimol injection site. (G) Black, psychometric curves for three consecutive sessions for the animal in (F); red, psychometric curve obtained after muscimol injection in contralateral V1. (H) Performance of the animals during the baseline sessions, muscimol injection session, recovery session and saline injection session. Black, RDK 100% coherence; gray, RDK 40% coherence; blue, auditory task. N=6 mice in RDK and auditory stimulus. (I) Fraction of trials in which animals did not report any choice. Circles, mean; errorbars, SEM. See also Figure S5.
