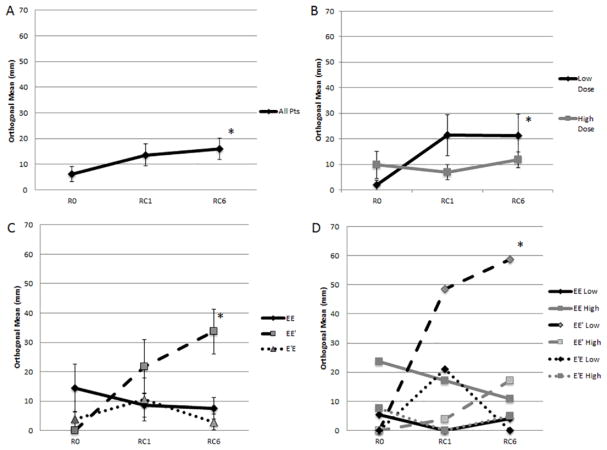
Figure 5.
DTH at baseline (R0), 1 month (RC1), and 6 months (RC6) post-PVS. Figure 5A: DTH in all patients. There was a significant increase in DTH over the course of the trial (p=0.04). Figure 5B: DTH by dosing group. The low dose group had a significant increase in their DTH response through the trial (p=0.03). Figure 5C: DTH by study arm. The EE′ arm had the greatest response, with a significant increase over time compared to the EE and E′E arms (<0.001). Figure 5D: DTH by study arm AND dosing group. Within the EE′ arm, the low dose patients showed the largest increase in DTH, with a significant increase from R0 (0±0mm) to RC1 (48.5±14.5mm, p=0.01) and RC6 (58.8± 7.7mm, p<0.001). *=p<0.05.

