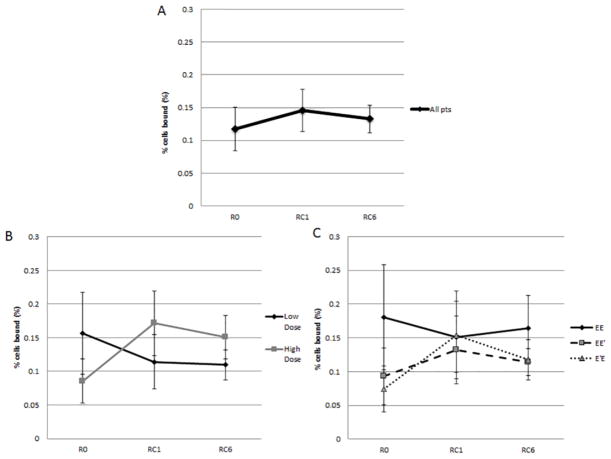
Figure 6.
CTL at baseline (R0), 1 month (RC1) and 6 months (RC6) post-PVS. Figure 6A: All patients CTL. There was no difference in levels of E39-specific CTLs (R:0.11±0.03%; RC1: 0.15±0.03%; RC6:0.13±0.02%, p=0.70). Figure 6B: CTL by dosing group. The high dose group had a non-significant increase in of E39-CTL between the R0 and RC1 (p=0.16), but a slight decrease at RC6. The low dose group had no significant change in CTL. Figure 6C: CTL by study arm. The EE′ (0.09±0.04% to 0.13±0.05%; p=0.57) and E′E (0.08±0.03% to 0.15±0.07%; p=0.32) groups experienced an increase in E39-specific CTL with the increase in the E′E group nearly a doubling in antigen-specific CTL.

