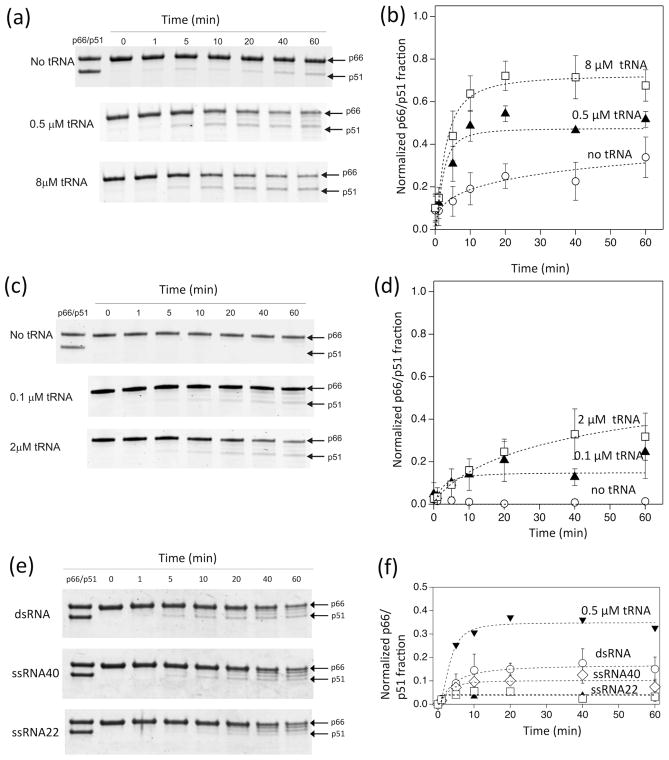
Figure 2.
Time dependence of p66 processing by HIV-1 PR in 20 mM sodium acetate buffer at pH 5.2 and 37 °C, monitored by SDS-PAGE (a and b) at a high concentration of p66 (8 μM as a p66 monomer, 4 μM as a dimer) proteolytically processed by 1 μM HIV-1 PR in the presence of 0, 0.5, 8 μM tRNA concentrations, (c and d) at a low concentration of p66 (1 μM p66 monomer concentration, 0.5 μM as a dimer) processed by 0.25 μM HIV-1 PR in the presence of 0, 0.1, and 2 μM tRNA concentrations, and (e and f) at a high concentration of p66 (8 μM as a p66 monomer, 4 μM as a dimer) proteolytically processed by 1 μM HIV-1 PR in the presence of 0.5 μM ds-RNA (40 nt/22 nt), ss-RNA (40 nt), and ss-RNA (22 nt). In (b, d, and f), p66/p51 fractions, determined from the gel images in (a, c, and e), are shown, respectively. Average data points were used to fit a curve with one standard deviation as an uncertainty of each data point. Since p66/p51 production occurs in parallel with p66 degradation by PR, the build-up curves do not necessarily reach a plateau. Because of these multiple factors, normalized χ2, χn2, values for the curve fits were between 0.2 and 10.7.

