Figure 4.
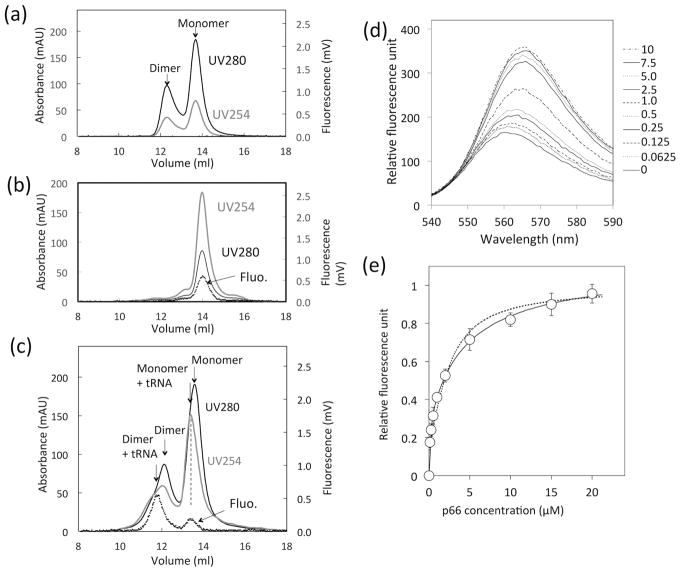
tRNA binding to p66 protein, monitored by (a – c) SEC elution profiles of (a) p66 protein solution, (b) tRNA solution, and (c) that mixed with tRNA, and (d, e) change of fluorescence emission of Cy3-labeled tRNA at varying p66 concentrations obtained by spectrofluorometry. In (a – c), UV absorbance at 254 nm (gray line) and 280 nm (black line), and fluorescence emission at 560 nm (dashed line) are shown. In (d), changes in fluorescence of total 1 μM tRNA, containing 40 nM Cy3-labeled tRNA, as a function of p66 concentration were recorded. In (e), fluorescence intensity changes at 560 nm (d) are plotted. The dash line is a fit-curve calculated with a single binding mode model (χn2 = 6.5), and the solid line indicates a fit-curve calculated with a two-binding mode model (χn2 = 0.8). The null hypothesis was rejected with p = 0.00036.

