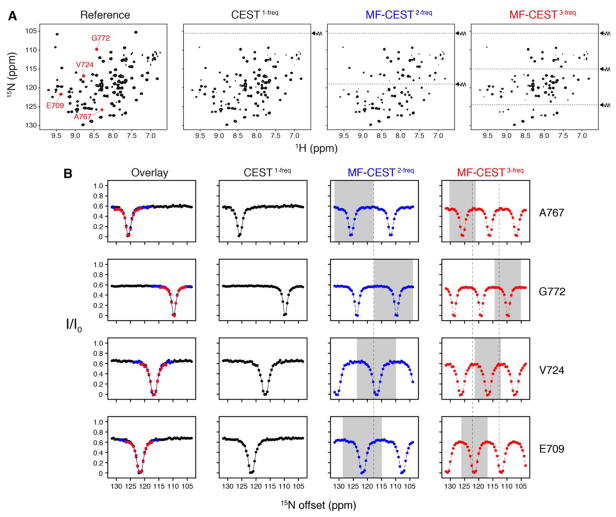
Figure 2.
15N CEST experiments applied to the cSH2 domain of PLCγ. (A) Example 2D spectra of the reference dataset, one-frequency CEST, and two- and three-frequency MF-CEST. The latter two spectra emphasize that two and three dips are created within the spectra (dotted lines indicate the application of rf saturation pulses). (B) CEST profiles for select residues highlighted in the reference spectrum shown in panel A. The overlay displayed on the left column illustrates the region of the MF-CEST curve that can be interpreted in an unambiguous manner to exchange (also highlighted in grey in individual MF-CEST profiles). The width of the saturation dip can be reduced by employing a reduced rf field (i.e., less than 25 Hz), which would enable better resolution of exchanging populations. However, no residues in cSH2 showed the presence of conformational exchange. Note that for the MF-CEST2-freq and MF-CEST3-freq columns in panel B, the white and grey regions are identical data points, which stems from the ambiguity of the multiple frequency excitations.

