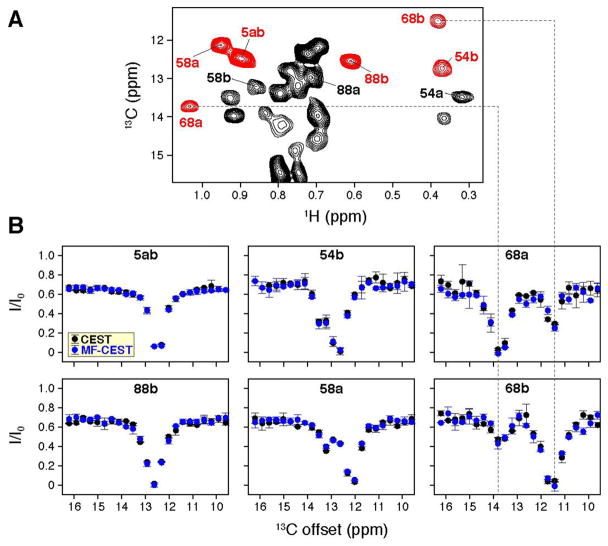
Figure 4.
CEST and MF-CEST applied to a system with conformational exchange. (A) Reference HMQC spectrum for ILV labeled EmrE in a perdeuterated background and bound to tetraphenylphosphonium. (B) Overlay of CEST (black) and MF-CEST (blue) curves for the Ile region of the spectrum. I5 and I88 show minimal chemical shift differences in the 13C dimension, while I54, I58, and I68 show the presence of two CEST dips that support the presence of exchange. The CEST dips for 68a and 68b match the respective curves (see dotted lines), which further emphasizes the ability to use MF-CEST for reducing the time needed for data collection.

