
Figure 3.
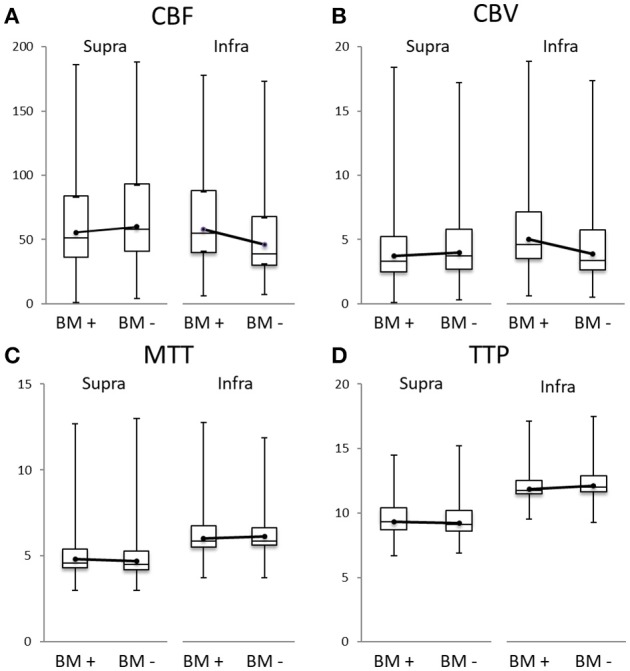
Boxplots of cerebral blood flow (CBF in ml/100 g/min, A), cerebral blood volume (CBV in ml/100 g, B), mean transit time (MTT in s, C), and time to peak (TTP in s, D) of the supra- (left side of each panel) and infratentorial area (right side), always for the brain metastases (BMpos = BM +) and their corresponding area without any BM (BMneg = BM –). The dots represent the mean. For better comparability between BMpos and BMneg, they are connected by a line.