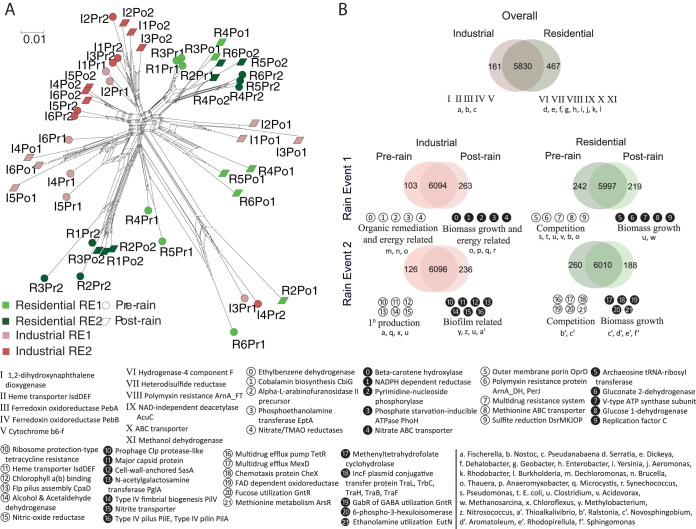
FIG 4 .
Distribution of microbial functions in urban waterways. (A) The neighbor-net network cluster of samples from the two land use types based on Bray-Curtis distance calculated using microbial community functional potential annotated through SEED databases. (B) Functional gene distribution between the two land use types and pre- versus postrain for the two rain events. Lighter shades show differential genera (t test; P < 0.05, standard Bonferroni correction, permutations = 999) and darker shades show commonly occurring genera. Functional gene categories are defined by most abundant functional genes. The functional genes in respective categories are annotated with numbers. Taxonomy assignments of genes in different groups are shown as lowercase letters.

