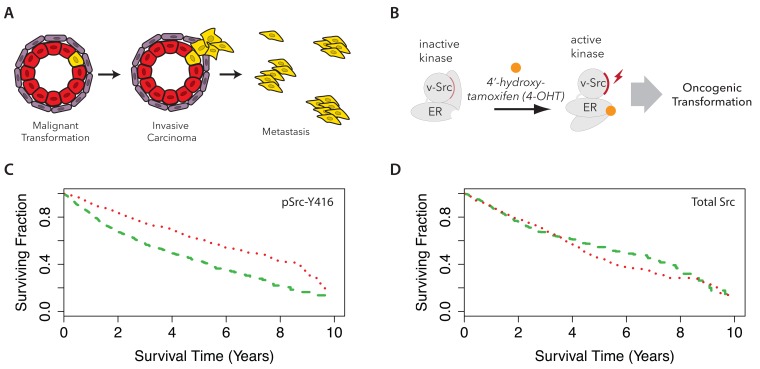
Figure 1. Active Src kinase is a predictor of poor clinical outcome.
Cartoon schematics illustrating the development of metastatic phenotypes ( A), and the Src-ER model system for oncogenesis ( B). ( C) The Cancer Genome Atlas patients were stratified into three cohorts based on reverse phase protein array intensities for pSrc-Y416. Kaplan-Maier curves for patients showing the top (green dashed line) and bottom (red dotted line) third signal are plotted. Log rank test p < 1 × 10 -10. ( D) A similar survival analysis as ( C) for total Src protein level signal.

