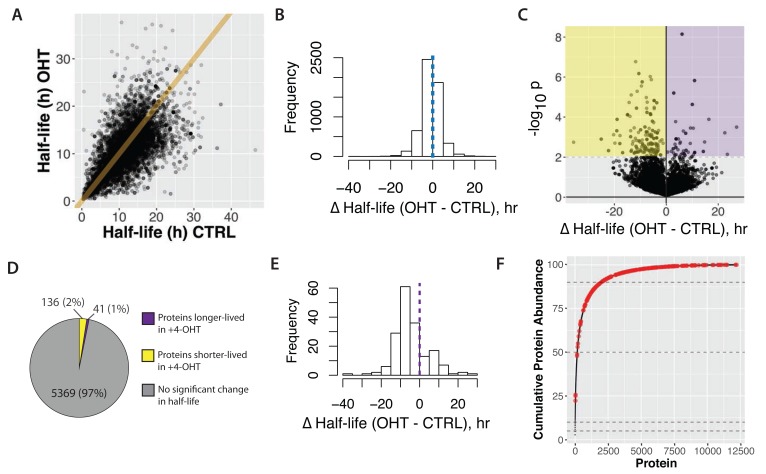
Figure 17. Comparison of half-lives in basal (CTRL) versus transformed (4-OHT) cells.
A) Scatterplot of half-lives in 4-OHT- versus control-treated cells. The equation of the line shown is y = x. B) A histogram of half-life difference between 4-OHT- and control-treated cells shown for all proteins. The dotted line in the centre indicates 0, i.e. no difference between the two conditions. C) Volcano plot of –log 10(p-value) versus difference in half-life. Yellow and purple shading demarcates cut-offs for proteins either significantly shorter-lived, or longer-lived, respectively, in 4-OHT-treated cells. D) Proportion of proteins that significantly change half-life. E) Histogram of half-life difference between 4-OHT- and control-treated cells shown for proteins that significantly change half-life. The dotted line in the centre indicates 0, i.e. no difference between the two conditions. F) Cumulative abundance plot (cf. Figure 4A) with proteins that significantly change half-life highlighted in red.

