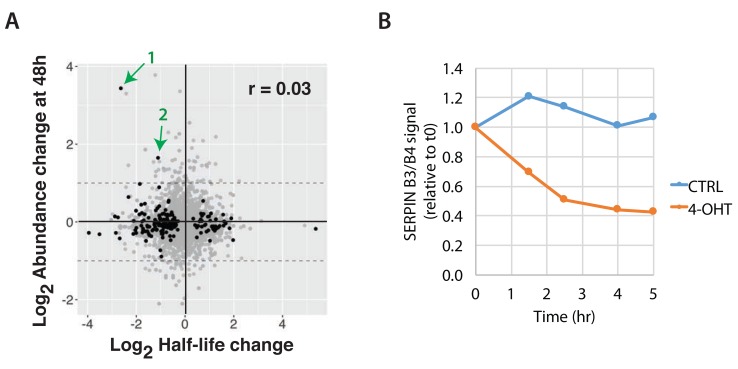
Figure 18. Cross-correlation of protein abundance and half-life changes.
A) Comparison of log 2 protein abundance ratio (4-OHT/CTRL) at 48 hr and log 2 half-life ratio (4-OHT/CTRL). Black points indicate p < 0.01. Green arrows indicate two proteins, SERPIN3&B4 ( 1) and SERPINB1( 2). The Pearson correlation (r) is 0.03. B) Densitometric quantitation of the immunoblot images obtained from analysis of cells that were treated with emetine (inhibitor of translation) for the indicated time points, harvested, and immunoblotted for beta tubulin and SERPINB3 & B4.

