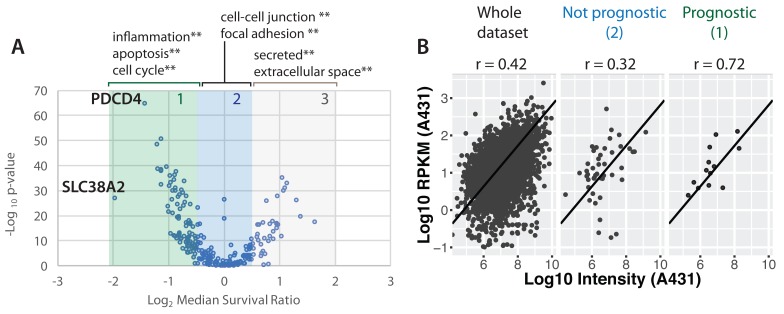
Figure 20. Prognostic markers are more likely to have correlated protein and mRNA levels.
A) Plot of –log10 p-value from log rank test for individual gene in predicting patient survival. Shaded boxes indicate three classes (‘class 1’, ‘class 2’, ‘class 3’) of ‘prognostic’ versus ‘non-prognostic’ genes. Enriched gene ontology terms for each group are shown above the scatter plot. Asterisks indicate enrichment p-value of less than 0.001. B) A scatter plot showing the mRNA and protein levels measured in the epithelial carcinoma cell line A431 ( Lundberg et al., 2010) for all proteins detected in our MCF10A Src-ER data set (left) and proteins that we have deemed ‘not prognostic’ (‘class 2’, middle) and ‘prognostic’ (‘class 1’, right).

