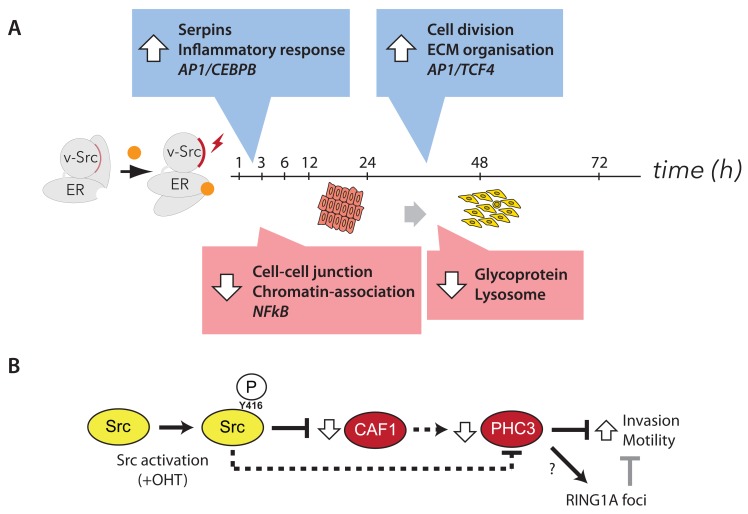
Figure 23. Summary model showing effects of Src activation on the cellular proteome.
A) Model illustrating the time-course of protein changes observed following v-Src activation. Captions show enriched GO terms from clusters displaying differential response kinetics. B) A model summarising the role of CAF1 and PHC3 in suppressing increased cell invasiveness phenotypes.

