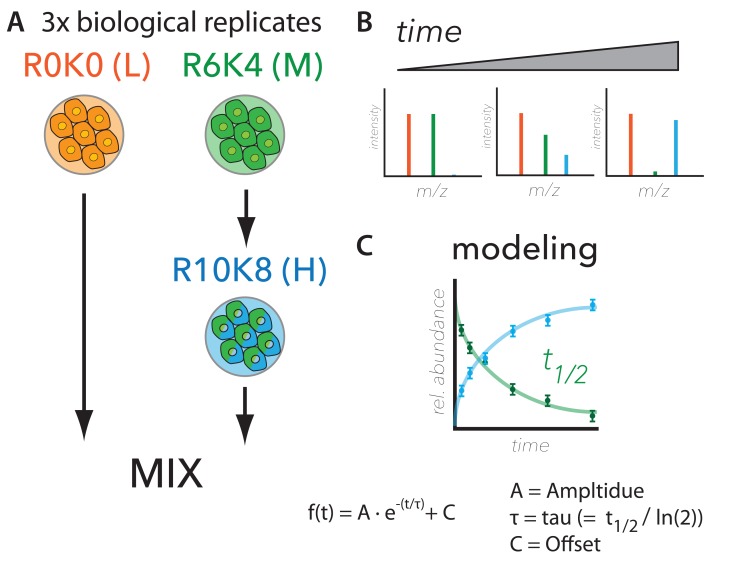
Figure 5. Workflow for comprehensive analysis of protein synthesis and degradation.
( A) Metabolic labelling strategy, ( B) expected ratiometric measurements, and ( C) modelling for measuring protein turnover. The experimental design used to measure protein half-life proteome-wide is largely based on ( Boisvert et al., 2012). Briefly, cells were labelled with Arg0-Lys0 (R0K0, “Light”) or Arg6-Lys4 (R6K4, “Medium”) stable isotope labelling with amino acids in cell culture (SILAC) media. The R6K4 labelled cells were then switched to Arg10-Lys8 (R10K8, “Heavy”) media and cultured for seven time points (i.e., 1, 3, 6, 12, 24, 48 and 72 hrs) before mixing with R0K0 and cell harvest. A schematic is shown of the expected SILAC MS data (top right panel). Data were modelled using an exponential fit, where t 1/2 is half-life.

