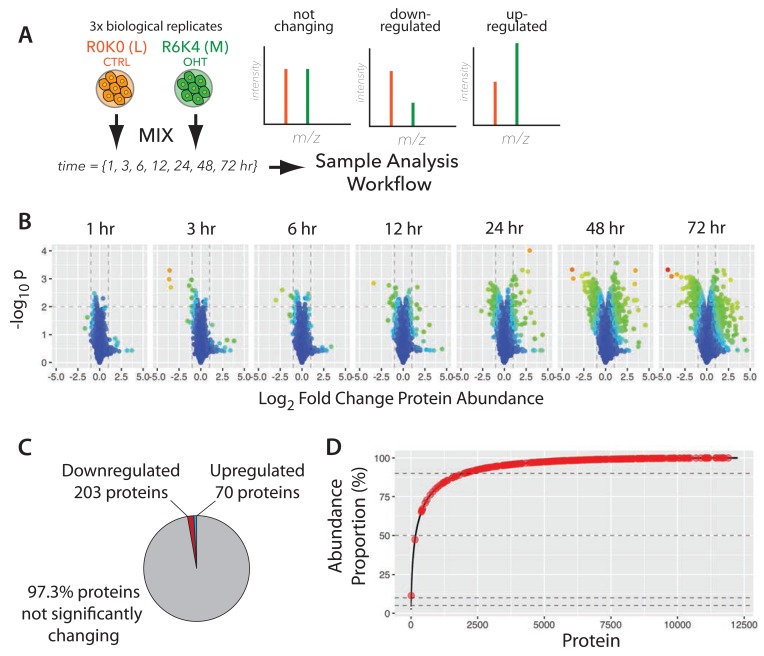
Figure 9. Dynamic remodeling of the proteomic landscape in response to v-Src kinase activation.
( A) The experimental design for measuring protein abundance changes. R0K0 and R6K4 labelled cells were treated either with vehicle control, or 4-hydroxytamoxifen (4-OHT) and incubated for the indicated times, prior to mixing and harvest. SILAC MS data expected from the time course are illustrated (right). ( B) ‘Volcano’ plots of –log 10 p-value versus log 2 fold change for the seven time points. ( C) Proportion of downregulated, upregulated, and not significantly changing proteins. ( D) Cumulative abundance plot (cf. Figure 4A) with significantly changing proteins highlighted in red.

