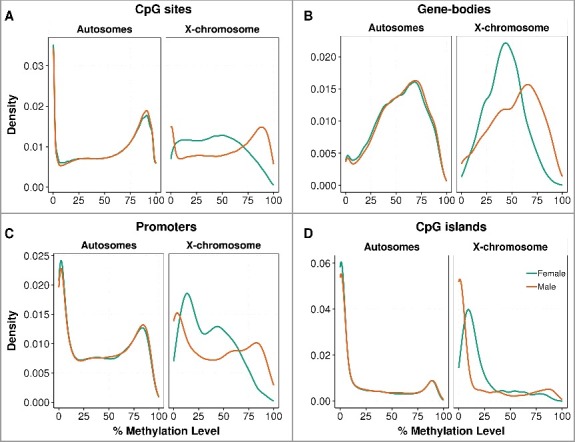
Figure 1.

Distribution of placental methylation level by fetal sex. The percentage methylation level was measured in autosomes separately from the chromosome X at (A) single CpG sites, (B) gene-bodies, (C) promoters, and (D) CpG island regions. The distribution curves were plotted by the kernel density estimation, where the area under the curve equals to one. The distributions of genome-wide methylation levels are shown in Supplementary Figure S2 and the methylation levels are described in Supplementary Table S3.
