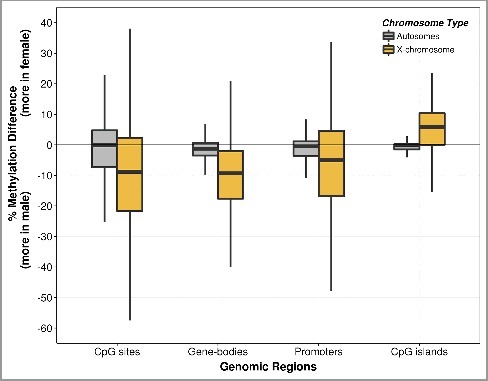
Figure 2.

Boxplot of methylation difference by fetal sex. The CpG methylation differences were obtained from the percentage methylation level of females (n = 2) subtracted by that of males (n = 2) at single CpG sites, gene-bodies, promoters, and CpG island regions. The methylation differences were measured in autosomes separately from the chromosome X. Each of the boxes shows the median and interquartile range (IQR). The vertical lines (whiskers) extended from the box represent a range of 1.5*IQR from both ends. Data beyond the end of the whiskers (i.e., outliers) are not shown. Boxplots of chromosome-wide methylation difference are shown in Supplementary Figure S3.
