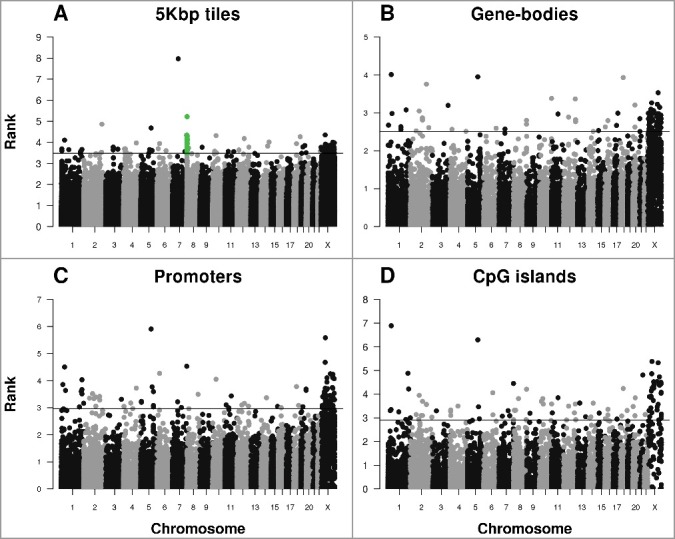
Figure 3.

Manhattan plot of highly ranked sex-specific differentially methylated regions. Each dot represents a (A) a tile of 5 kb, (B) gene-body, (C) promoter, and (D) CpG island region. Dots above the horizontal lines represent top 100 highly ranked DMRs within each figure. The green dots in (A) represent 20 top ranked DMRs within CSMD1. The rank in Y-axis is converted from the combined rank of RnBeads (see Methods).
