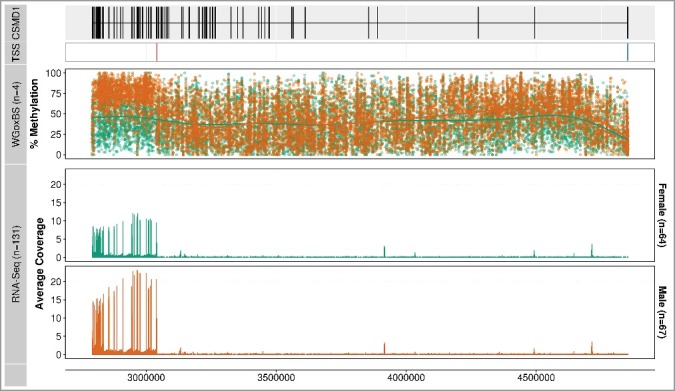
Figure 5.

Methylation profiles and RNA-seq coverage over the CSMD1 locus. The first track displays the gene structure of the entire CSMD1 locus (8:2,792,875-4,852,494) and the second panel shows the methylation profile of the WGoxBS samples (n = 4), where each dot represents one CpG site for each individual. The third track displays the mean RNA-seq coverage of 64 female and 67 male placental samples. Note that most of the RNA-seq reads are aligned toward the 3’ end, where the differentially methylated regions are located (displayed in Figure 4). Canonical and placenta-specific transcription start sites are shown in blue and red, respectively.
