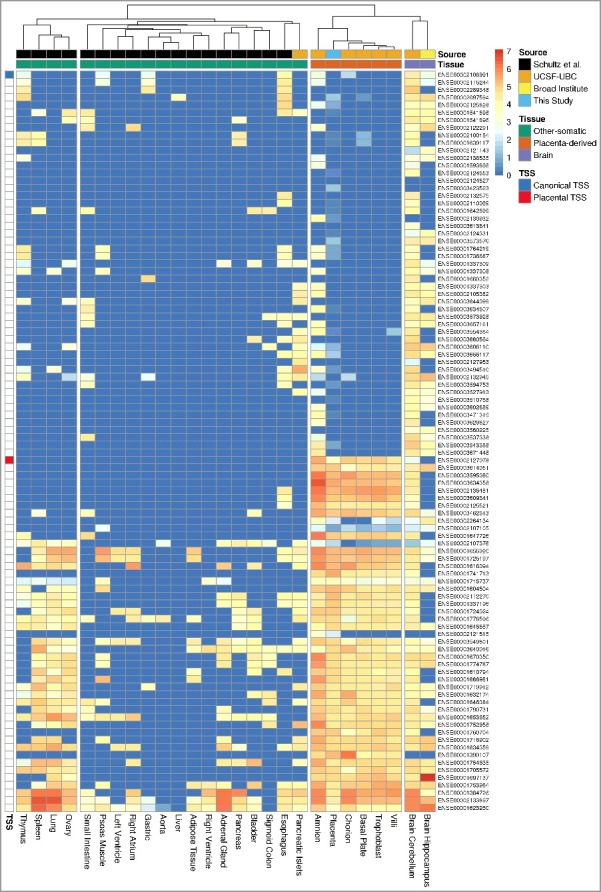
Figure 6.

Hierarchical clustering of tissues based on the relative expression level of CSMD1 exons. Each column represents a tissue and each row represents an Ensembl CSMD1 exon. The relative expression is measured in the log-scale of FPKM (see Methods) and it is colored from red (high) to dark blue (low). The columns (tissues) are hierarchically clustered by the similarity of the expression pattern and the rows (exons) are ordered by the position of exons within the CSMD1 transcript: transcript-start (top) to transcript-end (bottom). Except the placenta (this study), the RNA-Seq datasets of other tissues are from the following three participating members of NIH Roadmap Epigenomics Mapping Consortium: Schultz et al. (GEO accession: GSE16256), UCSF-UBC (GEO accession: GSE16368), and Broad Institute (GEO accession: GSE17312). Exons that contain canonical and placenta-specific transcription start site (TSS) are shown in blue and red, respectively.
