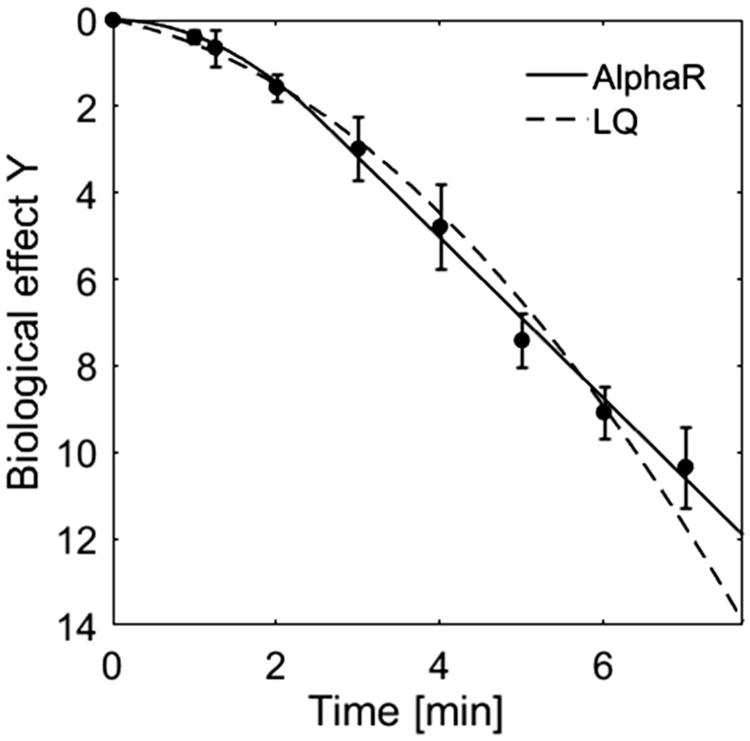
Figure 1.
Comparison of the fit of HT (48 °C) cell survival data of HCT116 cells by the AlphaR (solid line) and LQ (dashed line) model. In contrast to the LQ model, the AlphaR model follows the initial shoulder and exponentially linear decay of the data. The corresponding coefficients of determination (R2AlphaR = 0.99, R2LQ = 0.98) further support this observation.

