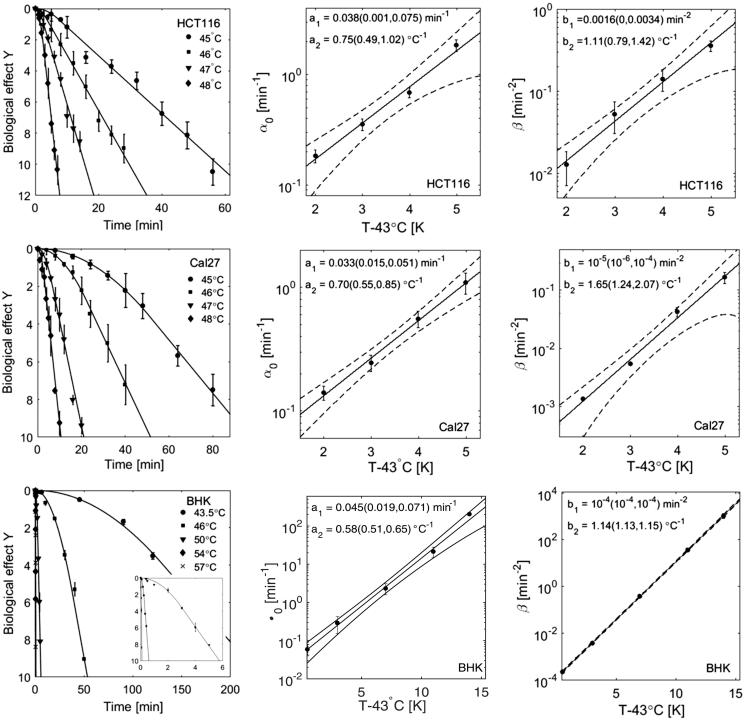
Figure 2.
HT cell survival curves at various treatment temperatures of three different cell lines (top: HCT116, middle: Cal27, bottom: BHK [36]) fit by the AlphaR model. The corresponding fit parameters, α0 and β, are plotted as a function of the difference of the heating temperature and 43 °C. This dependence is well described by an exponential fit (solid line, 95% confidence bounds are shown as dashed lines) with the parameters of this exponential (a1 and a2, or b1 and b2) being shown here with the corresponding 95% confidence bounds.

