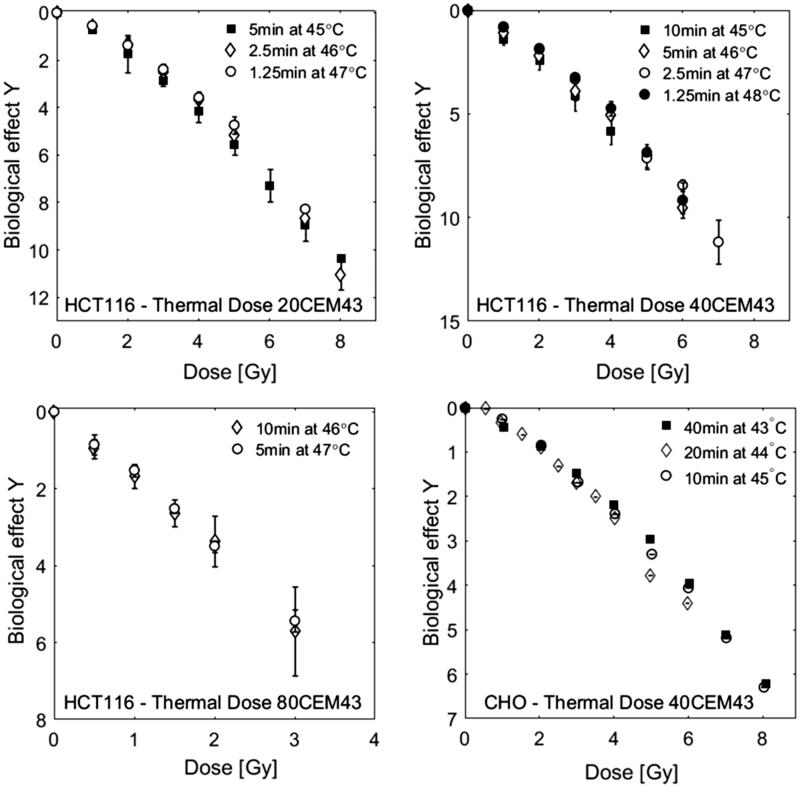
Figure 4.
Comparison of HCT116 and CHO [37] cell survival curves for combination treatments of RT and HT for the same thermal dose (20–80 CEM43), but different heating temperatures and durations as indicated in the legends. Cell survival data were normalised to 100% after HT treatment. Within the range of uncertainties of the clonogenic assay, there is good agreement between data sets originating from different time/temperature combinations.

