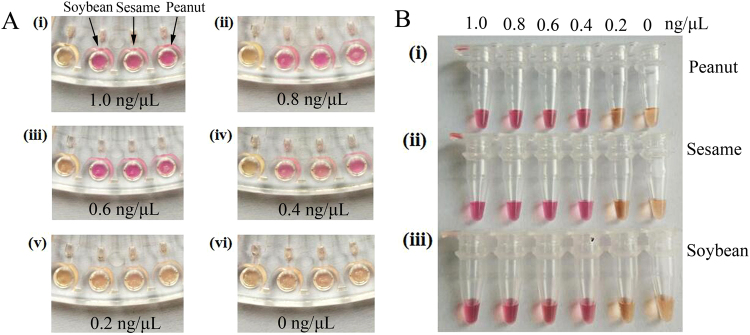
Figure 3.
Results of the colorimetric test for the sensitivity of the LAMP-microfluidic chip detection method. (A) Sensitivity for mixed DNA samples of peanut, sesame and soybean in LAMP-microfluidic chips. From right to left, allergen primers of peanut, sesame, soybean and control water were added to each. The concentration gradient of the mixed DNA sample was 1, 0.8, 0.6, 0.4, 0.2, and 0 ng/μL from (i) to (vi), respectively. (B) For (i) to (iii) the primers added were the allergen primers for peanut, sesame and soybean, respectively. The concentration gradient of the mixed DNA sample was 1, 0.8, 0.6, 0.4, 0.2, and 0 ng/μL.

