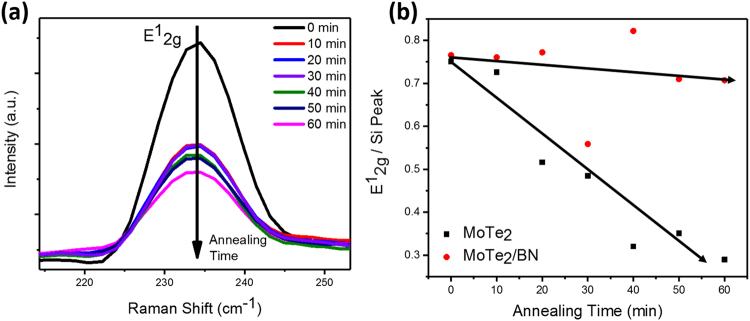
Figure 2.
(a) Raman spectra of the E12g peak intensity variation for few monolayers thick 2H-MoTe2 flakes exposed to 100 °C in air for the shown time intervals. (b) Comparison of E12g peak intensities changes as a function of 100 °C in air holding time for uncapped MoTe2 and BN-capped MoTe2 flakes; to facilitate the comparisons and avoid errors due to absolute peak intensity changes over time, the peak intensity was normalized to the Si substrate peak (520.5 cm−1). The shown linear fitting was used to calculate E12g peak intensity decline due to oxidation processes for 2H-MoTe2 and 2H-MoTe2/a-BN.

