Fig. 2.
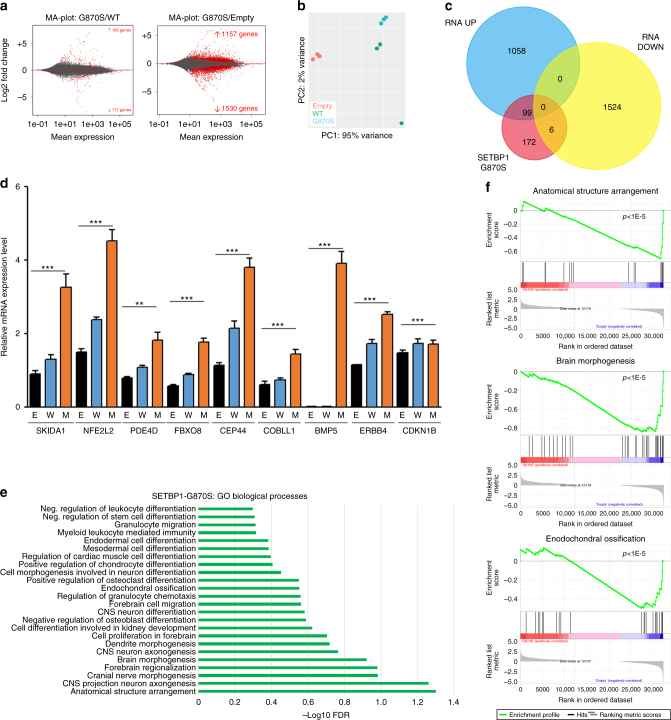
Effect of SETBP1 G870S expression at the transcriptional level. a MA plot showing the expression data of SETBP1-G870S vs. SETBP1-WT (left) and SETBP1-G870S vs. Empty cells (right) as a function of log ratios (M) and mean average gene counts. b Variance distribution of 3 Empty, 3 SETBP1-WT, and 3 SETBP1-G870S clones emphasized by Principal Component Analysis 1 (PC1) showing 95% of total variance. c Venn diagram showing the number of differentially expressed genes being directly bound by SETBP1 within their promoter region (red circle). d Q-PCR analysis of a subset of SETBP1 DEGs identified by RNA-Seq: E (Empty), W (SETBP1_wt), M (SETBP1_G870S). The housekeeping gene GUSB was used as an internal reference. Experiments were performed in triplicate; statistical analysis was performed using t-test. Error bars represent the standard error. **p < 0.01; ***p < 0.001. e Dysregulated GO biological process revealed by functional enrichment analysis of the differentially expressed genes resulting from G870S mutation. f Gene set enrichment analysis displaying three of the most enriched categories. Genes are shown as a function of the enrichment score (y axis in the upper part) and relative gene expression (x axis)

