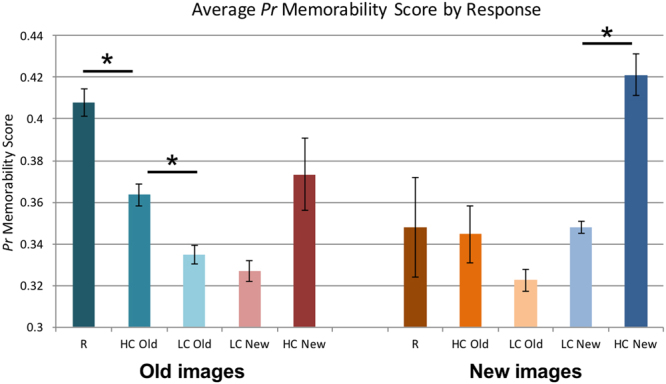
Figure 2.

Average Pr memorability score (from the online memory test) for each image type (old or new) and response type of the participants in the scanner experiment. Error bars indicate standard error of the mean. Asterisks (*) indicate a significant Bonferroni-corrected pairwise difference between conditions (p < 0.001). All correct trials (e.g., responding “old” for an old image or “new” for a new image) showed significantly higher memorability for images with more confident responses (R = Recollect, HC = high confidence, LC = low confidence). Note that large error bars are seen for trial types with small numbers of trials; all correct response types had on average over 35 trials per participant, while incorrect response types had fewer (e.g., HC New for old images had on average only 11 trials per participant, R for new images had only 2 per participant, and HC Old for new images had only 11 per participant).
