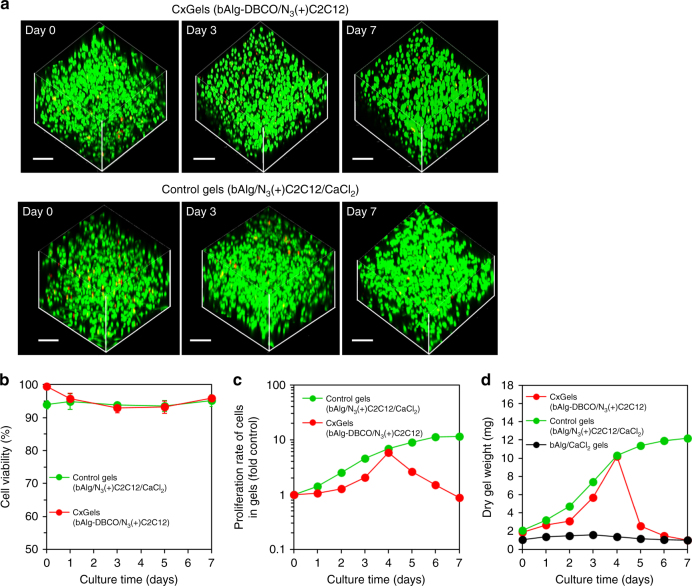
Fig. 3.
Characterizations of the CxGels. a (upper) CLSM images of CxGels prepared through click reaction between azide-modified C2C12 cells (2.0 × 10⁶ cells) and bAlg-DBCO solution (2%) after live/dead assay. (lower) CLSM images of C2C12 cells-encapsulating control physical gels prepared through physical cross-linking reaction between bAlg solution (2%) and CaCl2 solution (0.5%) in the presence of azide-modified C2C12 cells (2.0 × 10⁶ cells) after live/dead assay. CLSM observation was carried out at days 0, 3 and 7 after CxGels preparation. Green fluorescence indicates live cells stained with calcein-AM and red fluorescence indicates dead cells stained with PI. Scale bars indicate 200 μm. b Cell viability of C2C12 cells in the CxGels prepared through click reaction between azide-modified C2C12 cells (2.0 × 10⁶ cells) and bAlg-DBCO solution (2%) and the cell-encapsulating control physical gels analyzed using the CLSM images after live/dead assay. Live/dead assay was performed at days 0, 1, 3, 5, and 7. Error bars: standard deviation (n = 3). c Proliferation rates of C2C12 cells existing in the CxGels prepared through click reaction between azide-modified C2C12 cells (2.0 × 10⁶ cells) and bAlg-DBCO solution (2%) and the control physical gels analyzed using the WST-1 assay. Error bars: standard deviation (n = 3). d Time-dependent changes in the dry CxGels weight, the cell-encapsulating control physical gel, and normal bAlg physical gels cultured in DMEM for 7 days at 37 °C. Error bars: standard deviation (n = 3)

