Figure 5.
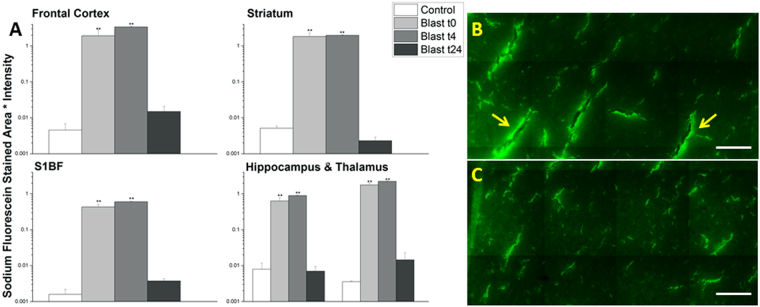
Quantitation of extravasation of sodium fluorescein for 15 minutes (t0), 4 (t4), and 24 (t24) hours post- 180 kPa blast exposure in frontal cortex, striatum, somatosensory barrel-field cortex, hippocampus, and thalamus using a semilog plot in order to capture magnitudinal differences (A). The frontal cortex was chosen for illustrative purposes and to qualitatively depict the difference between 4 (B) and 24 hrs (C). Arrows indicate areas of leakage from the vessels, which are more pronounced in 4 hours than any other time point studied in this investigation. **indicates a difference in intensity compared with control with a statistical significance of p < 0.01. Scale bar = 100 μm.

