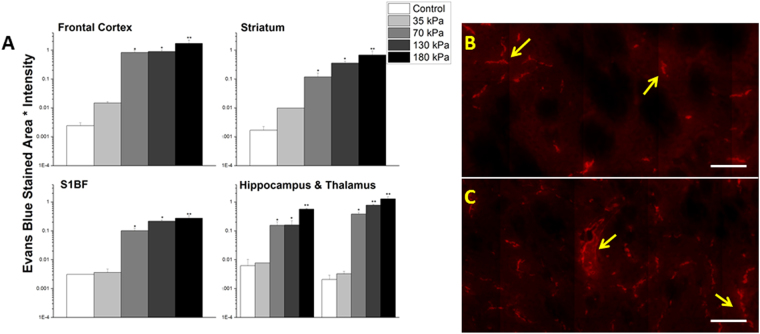
Figure 7.
Quantitation of extravasation of Evans blue for 35, 70, 130, and 180 kPa blast overpressures, 15 minutes post-exposure in frontal cortex, striatum, somatosensory barrel-field cortex, hippocampus, and thalamus using a semilog plot in order to capture magnitudinal differences (A). The striatum was chosen for illustrative purposes and to qualitatively depict the difference between 70 (B) and 130 kPa (C). Leaks appear longer and more intense with increasing overpressure in the same brain regions. *Indicates a difference in intensity compared with control with a statistical significance of p < 0.05, **Indicates p < 0.01. Scale bar = 100 μm.

