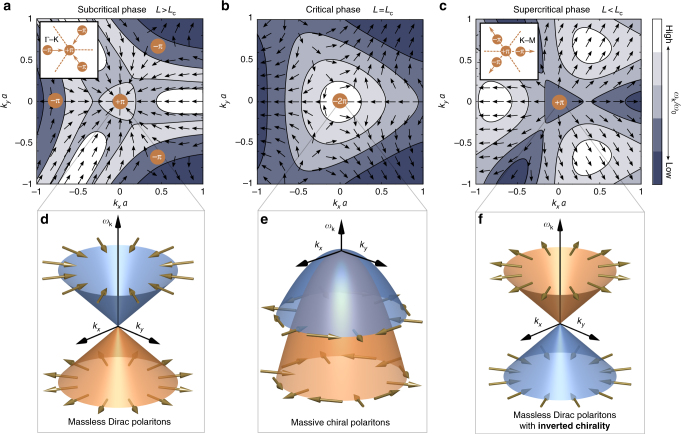
Fig. 5.
Merging of type-I and type-II Dirac points with chirality inversion. a–c Pseudospin vector field and isofrequency contours (see Methods for the specific isofrequency values) for the upper polariton band near the K point for a subcritical (L = 2.3a), b critical (L = Lc = 1.78a), and c supercritical (L = 1.4a) cavity heights, respectively, as obtained from . The Dirac points (corresponding to vortices) are depicted by orange circles along with their associated Berry flux. Before criticality, three type-II SDPs (−π Berry flux) are driven towards the type-I CDP (π Berry flux) along the Γ−K directions as the cavity height is reduced (see inset in a). At the critical cavity height Lc, they merge together forming a quadratic band-degeneracy with combined Berry flux of −2π (see b). After criticality, the type-II SDPs re-emerge and are driven past the type-I CDP along the K−M directions (see inset in c). After a small decrease in cavity height, these SDPs annihilate other SDPs that migrate along the opposite direction and have opposite Berry flux, leaving only the type-I CDP remaining in the spectrum with π Berry flux (see c). d-f, Effective polariton spectrum near the K point to leading order in k. The colors of the bands correspond to the chirality of the Dirac polaritons as defined in the main text, where the orange and blue bands indicate a chirality of +1 and −1, respectively. The spinor eigenstates, represented by pseudospin vectors (gold arrows), describe d massless Dirac polaritons with a linear dispersion and Berry phase of π, e massive chiral polaritons with a parabolic dispersion and Berry phase of −2π, and f massless Dirac polaritons with a linear dispersion and Berry phase of π, but with inverted chirality. All pseudospin and contour plots are obtained with and Ω = 0.01ω0

