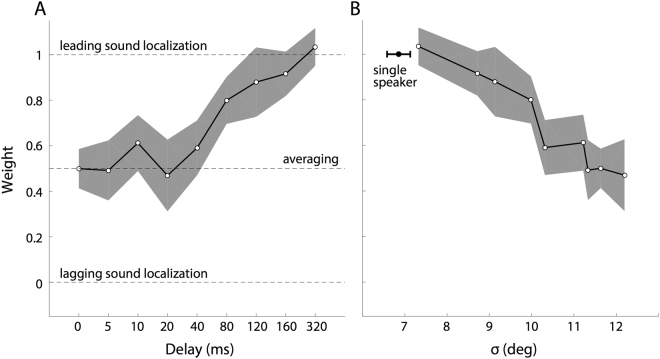
Figure 4.
(A) Time-dependent weighted averaging. Results of the weighted-averaging model (Eqn. 3), averaged across subjects, for all onset asynchronies between 0 and 320 ms. Up to a delay of approximately 40 ms the weight remains close to 0.5, indicating full averaging. For delays >40 ms, the weight of the leading sound gradually increases. However, even at a delay of 160 ms, the lagging sound still influences response accuracy to the leading sound. Note that the delay is not represented on a linear scale. (B) Spatial blurring. Weight versus standard deviation of the response data around the model fit (Eqn. 3). The larger the weight, the smaller the standard deviation, hence the more precise the responses. Compare with Fig. 4, right-hand column. Filled dot: grand-averaged single-speaker localisation result with standard deviation.

