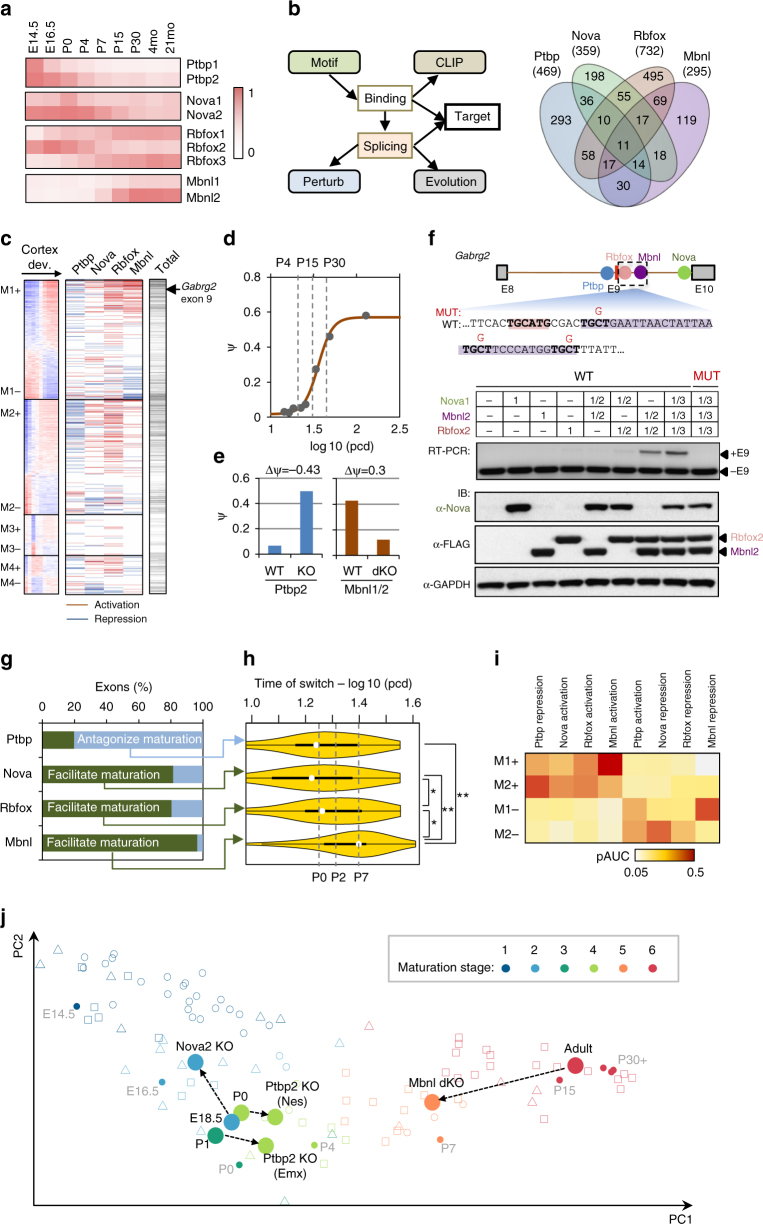
Fig. 4.
A set of tissue-specific or neuron-specific RBPs regulate the timing of developmental splicing switches. a Dynamic expression of four families of tissue-specific RBPs, including Ptbp1/2, Nova1/2, Rbfox1–3, and Mbnl1/2. RPKM values are normalized based on the maximum expression value in each family separately and shown in color scale. b Integrative modeling to define the target alternative exons regulated by each RBP family. The Venn diagram summarizes target exons regulated by each RBP family. Note 11 exons regulated by all four RBP families and an additional 58 exons regulated by three RBP families. c Regulation of WGCNA module exons by each of the four RBP families. Activation and repression of an exon by each RBP resulting from integrative modeling analysis are indicated in red and blue, respectively. The total number of regulators for each exon is shown in the bar on the right in gray scale (the darker, the more regulators). d–f Gabrg2 exon 9 as an example in module M1 under combinatorial regulation by all four RBP families. The exon inclusion level in developing cotex is shown in d and changes upon depletion of Ptbp2 (P0) and Mbnl1/2 (adult) are shown in e. Inclusion of the exon in wild type (WT) and mutant (MUT) splicing reporters, in combination with overexpression of different RBPs, is shown in (f). Rbfox-binding and Mbnl-binding site sequences are shaded. RBP expression and exon inclusion were measured by immunoblot and RT-PCR, respectively. g RBPs either antagonize (Ptbp2) or facilitate (Nova, Rbfox, and Mbnl) the mature splicing pattern through activation or repression of exon inclusion. h Time of the maximal splicing switch for target exons regulated by specific RBPs (*p < 0.05, **p < 0.001, t test). Only exons showing a more mature (for Ptbp) or embryonic (for Nova, Rbfox, and Mbnl) pattern upon RBP depletion were included for this anlaysis. i Prediction performance of exon module membership based on regulation by each RBP family. The performance is measured by partial area under curve (pAUC) of the receiver operating characteristic (ROC) plot with a cutoff at false-positive rate (FPR) ≤0.1. j Changes of predicted maturation stages of mouse brain tissues upon depletion of RBPs

