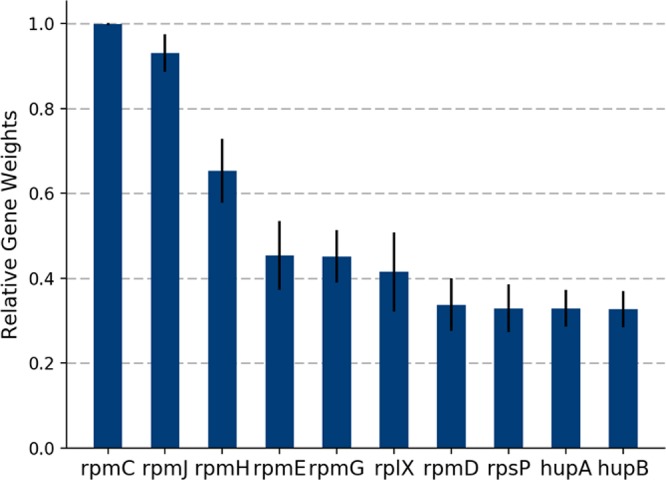
Figure 3.

Bar plot showing the relative gene weight W for the 10 most informative genes that can be used for spectral identification. The gene weights were obtained with the double cross-validation procedure using 403 MALDI-TOF spectra and protein sequences of 1276 species in Unirpot. The relative gene weights were averaged from 500 trials of the double cross-validation procedure.
