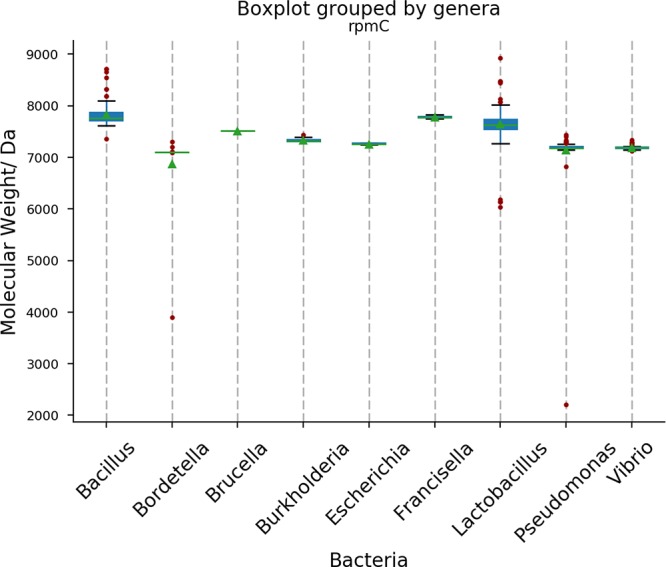
Figure 5.

Variation of the molecular weights of the proteins encoded by rpmC in different genera using the protein sequences database from UniProt. Red dots shows outliers, the green triangle indicates mean value, the green line shows the median value, and the blue box shows values between inter quartile range (25%–75%).
