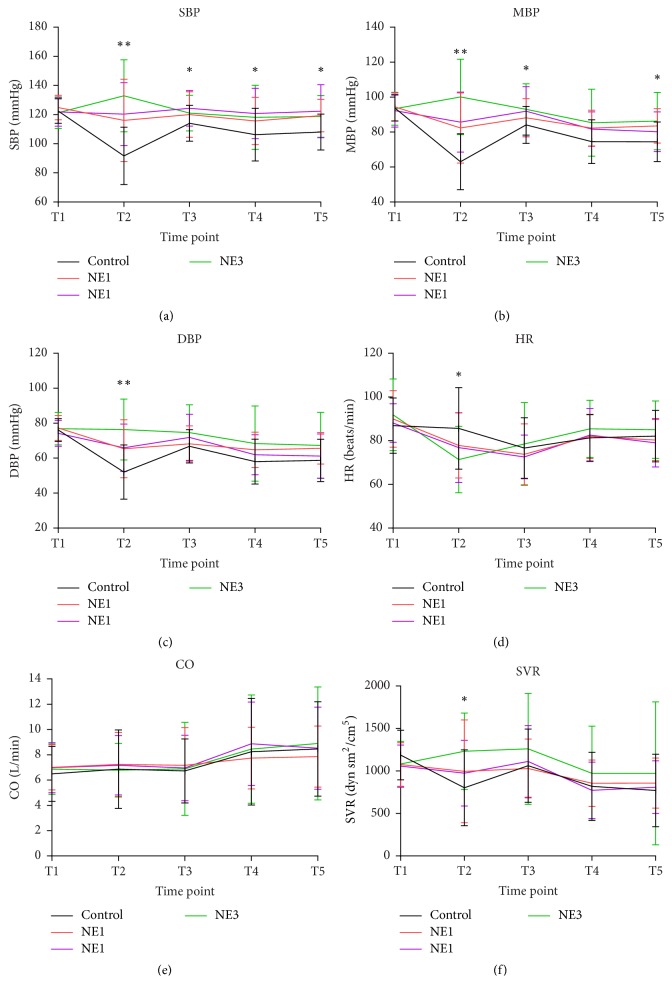
Figure 2.
Hemodynamic changes. Data are shown for five timepoints: baseline (T1), the highest level of sensory block (T2), delivery (T3), oxytocin administration (T4), and end of surgery (T5). Data are presented as mean (SD). Asterisks in the upper blank indicate overall significance of each timepoint. ∗p < 0.05; ∗∗p < 0.01. Post hoc multiple comparison results are shown in supplementary Table S2.

