
Fig. 4. Nitric oxide (NO) release and its role in attenuating CYP2E1 activity and resulting in decreased inflammation in progressive NAFLD.
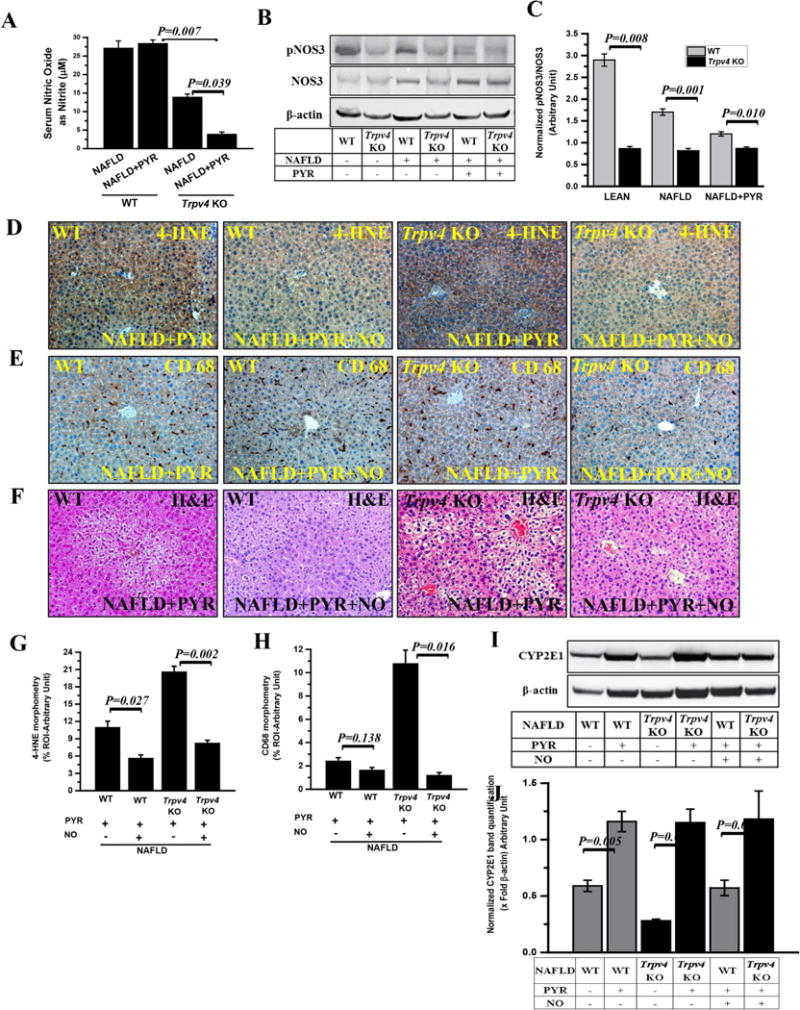
(A) Nitric oxide release measured as total nitrite (μM) in mouse serum of WT-NAFLD, WT-NAFLD+PYR, Trpv4 KO-NAFLD and Trpv4 KO-NAFLD+PYR mice. (B) Immunoblot of phosphorylated NOS3- Ser 1177 (pNOS3) and NOS3 protein in liver homogenate of both wild-type (WT) and Trpv4 KO mice fed with chow diet (LEAN, n=3), high-fat- diet fed (NAFLD, n=4) and high-fat-diet fed mice exposed with pyrazole (NAFLD+PYR, n=3). (C) Bar graphs represents protein band quantification analysis of western blot and β-actin normalized pNOS3/NOS3 ratio in respective groups of mice was plotted on y-axis. (D and E) To study the role of nitric oxide, both WT and Trpv4 KO mice groups were co-exposed with pyrazole and nitric oxide donor (NO, DETANONOate). Representative immunohistochemistry images depicting 4-HNE immunoreactivity (D) and CD68 immunoreactivity (E) in WT-NAFLD+PYR (n=3), WT-NAFLD+PYR+NO (n=3), Trpv4 KO-NAFLD+PYR (n=4) and Trpv4 KO-NAFLD+PYR+NO (n=3) liver. Images were taken at 20X magnification. (G and H) Bar graph showed morphometric analysis (% ROI) of 4-HNE (G) and CD68 (H) immunoreactivity (n=3). (F) Representative Hematoxylin and Eosin stained images of liver sections showed pathophysiology of WT-NAFLD+PYR (n=3), WT-NAFLD +PYR+NO (n=3), Trpv4 KO-NAFLD+PYR (n=4) and Trpv4 KO-NAFLD+PYR+NO (n=3). Images were taken at 20X magnification. (I and J) Immunoblot of CYP2E1 (I) and morphometric analysis (J) in WT-NAFLD (n=4), WT-NAFLD+PYR (n=3), Trpv4 KO-NAFLD (n=3), Trpv4 KO-NAFLD+PYR (n=4), WT-NAFLD+PYR+NO (n=3) and Trpv4 KO-NAFLD+PYR+NO (n=3) liver homogenate. Data points were represented with means ± SEM, unpaired t-test.