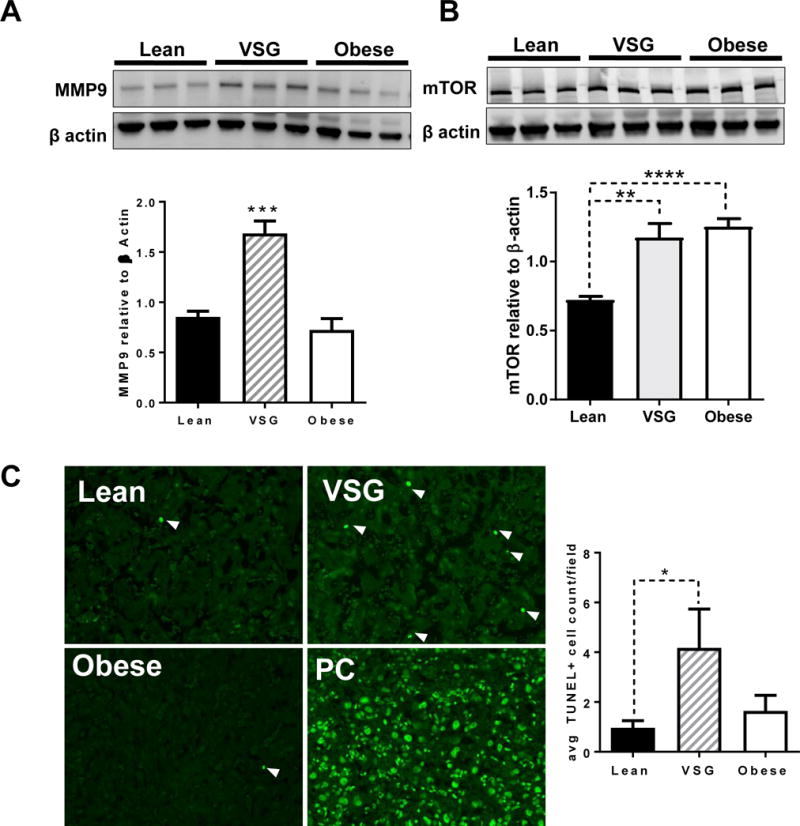
Figure 7. Validation of three unique pathways altered by maternal VSG in the placenta.

(A) Analysis of MMP9 protein by Western blot and normalized to β actin. (B) Protein levels of mTOR normalized to β actin by western blot. N = 3-5/group. (C) TUNEL staining of Lean, VSG and Obese placenta with positive control (PC) shown N=9-13/group. One way ANOVA with Tukey’s post hoc, *P < 0.05, **P < 0.01, ***P < 0.001. Data are presented as mean ±SEM.
